Energy prices are again on the rise. The Brent Crude price per barrel on 31st December 2020 was US$ 51.22. A year later, on 27th December 2021, it was $ 75.24.
It seems déjà vu as we recall the sharp rise (92%) in average Brent Crude price between Dec 2008 to Nov 2009. Energy-intensive operations like Data Centers had to take immediate measures in 2009. They are better prepared today and have started doing more.
Data Center Energy Management: Traditional Approach
Facility Managers and Data Center operators have traditionally used Building Management Systems (BMS) for monitoring their power and cooling systems to receive timely alerts when critical parameters deviate from normal.
A first inflection occurred in 2006 when The Green Grid introduced the metric Power Usage Effectiveness (PUE), which continues to be the de facto standard for measuring energy efficiency in Data Centers. This followed with emergence of a new software category, Data Center Infrastructure Management (DCIM). DCIM’s adoption grew with energy costs dominating OPEX in most large data centers as crude oil prices spiked in 2009. Both BMS and DCIM were extended to provide time-wise/device-wise energy reports, trend graphs and KPIs like PUE.
The New Approach: Energy Analytics
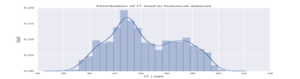
Energy Analytics Example
While the PUE number is derived from a simple ratio, it is a function of multiple variables, each of which can have an impact on the final PUE measure. Driving home this point very well is a statement by Google: “Just 10 pieces of equipment, each with 10 settings, would have 10 to the 10th power, or 10 billion, possible configurations.”
The next inflection can be traced to Google’s experiments with Artificial Intelligence (AI) and Machine Learning (ML) in the period 2014-16 for resolving the “10 billion possible configurations” with the aim of getting the PUE in all their Data Centers as close to 1.0, a seemingly impossible task then. They did it and published their results. With that, a new discipline emerged: Energy Analytics in Data Centers. Some examples where this can be applied:
- Optimal cooling required for different IT loads to derive the best PUE
- Areas of White Space that can do with less cooling to derive best PUE
- PAC units performing below par and therefore needs attention
- Optimal load distribution between different UPS units
For more on this subject and how GFS can help with Energy Analytics in Data Centers, please see: https://greenfieldsoft.com/wp-content/uploads/GFS-Crane-Miner-Data-Sheet.pdf